Wireless Security System Using PIR Sensors Project

This project demonstrates a wireless security system in which four pyroelectric infrared (PIR) motion sensors are placed in four sides—front, back, left and right—of the area to be covered. It detects motion from any side and turns on the audio-visual alarm. It also displays the side where the motion (intruder) is detected. All sensors send signal to the central controller circuit wirelessly. The author’s prototype arrangement is shown in Fig. 1.

Wireless Security System Using PIR Sensors Project
 Fig. 1: Author’s prototype arrangement for Wireless security system

System block diagram

System block diagram of the wireless security system is shown in Fig. 2. The project uses PIR motion sensors to detect motion and ASK-based radio frequency (RF) transmitter and receiver modules to send signals wirelessly. It uses AT89S52 microcontroller (MCU) and LCD to display the side where the motion is detected.

 Fig. 2: Block diagram of wireless security system using PIR sensors

The block diagram has two parts: four transmitter units with PIR sensors, encoders and RF transmitters; and receiver unit with RF receiver, decoder, MCU and some audio-visual circuits.

Transmitter unit

There are four transmitter blocks, one each for front, back, left and right sides. Each block consists of a PIR sensor, RF encoder chip and RF transmitter (Tx) module.

PIR sensor

The PIR sensor detects motion by measuring any change in IR levels emitted by objects. Pyroelectric devices have elements made of a crystalline material, which generate an electric current when exposed to IR radiation. Changes in the amount of IR falling on such devices changes the voltages that are generated. Sensor output goes high when it detects motion. Sensor output is given to RF encoder chip.

RF Encoder

HT12E encoder chip encodes PIR sensor output into serial bit streams and gives it to RF Tx module.

RF transmitter

ASK transmitter modulates incoming digital signals from the RF encoder using a 434MHz carrier and transmits it through its antenna.

Receiver unit

This is the central controlling section that receives signals from any of the four PIR sensors at the transmitter side. It gives audio and visual alarms, and displays the side where the motion is detected on LCD1.

RF receiver

This module operates on 434MHz frequency and demodulates the received digital signals before sending bit streams to RF decoder chip.

RF decoder

HT12D RF decoder chip decodes bit streams and generates parallel 4-bit digital output, which is given to the MCU.

MCU

AT89S52 MCU performs the following tasks:

1. Detects side where motion is detected from RF decoder digital output

2. Displays various messages including side of detected motion on LCD1

3. Turns on speaker and blinks LED for audio-visual alarm when motion is detected
LCD panel

The 16×2 LCD panel displays messages given by the MCU.

Multivibrators

There are two multivibrators. One for blinking the LED at low frequency (1Hz – 2Hz), and the other for generating the audio frequency signal (1kHz) through the speaker for siren.

Circuit and working

There are five circuits. Of these, four transmitter circuits are similar to each other, with minor changes, as shown in Fig. 3. Fifth circuit, as shown in Fig. 4, is the receiver circuit.

Wireless Security System Using PIR Sensors circuit
Fig. 3: The four transmitter circuits


Wireless Security System Using PIR Sensors circuit 1
 Fig. 4: Circuit diagram of MCU-based central receiver circuit


Transmitter circuit

The first transmitter circuit is built around IC1. Output of PIR sensor PS1 is given to data input AD8 (pin 10) of HT12E (IC1) after inverting it through transistor T1. Diodes D1 and D2 connect transmission enable (TE) pin with pin AD8, so that both pins get input from the sensor at the same time.

LED1 is connected to collector output of T1, so that it blinks when PS1 sensor output goes high. Address pins A0 through A7 of IC1 are connected to ground to set address 00 (0000 0000b). Serial data output DOUT (pin 17) is given as data input to 434MHz RF Tx module (TX1). The whole circuit is given power through 6V battery (BATT.1) connected across CON1.

The other three circuits are shown in Fig. 3 are similar to the one described above. The only difference is that the diode is connected to different data pins.

When PIR sensor PS1 detects motion, its output goes high. T1 conducts and LED1 blinks.

Pins AD8 and TE of IC1 are pulled low together through diodes D1 and D2. When TE pin is pulled low, IC1 transmits address A0 through A7, and AD8 through AD11 serially through RF Tx module. Because pin AD8 is pulled low, data bits are transmitted as 1110 (AD11 through AD8). Similarly, in other such circuits, when motion is detected, the respective data pin is pulled low, so different data is transmitted, as listed in Table I.


Thus, when a sensor detects motion from its side, different bit pattern of D0 through D3 is transmitted. At receiver side, this pattern is used to identify the side where motion is detected.
Receiver unit

As shown in Fig. 4, the receiver is built using 434MHz RF Rx module (RX1), RF decoder chip HT12D (IC5), AT89S52 MCU (IC6) and NE555 multivibrators (IC7 and IC8).


Sourced By : EFY Author:  Ashutosh M. Bhatt
Read More

Build Lie Detectors Circuits Project

LIE DETECTOR-1
This circuit detects the resistance between your fingers to provide an oscillation. The detection-points can detect resistances as high as 300k and because the resistance decreases, the frequency increases.


Separate the 2 bit pads and fasten them to the back of every hand. because the subject feels nervous, he can sweat and alter the frequency of the circuit.The photos show the circuit engineered on computer boards
with separate bit pads.


LIE DETECTOR-2
This circuit detects the resistance between your fingers to turn on the FALSE LED. The circuit sits with the TRUE LED illuminated. The 47k pot is adjusted to permit the LEDs to change state when touching the
probes. 


LIE DETECTOR-3
This circuit detects the resistance between your fingers to show the four LEDs. As you press tougher, more
LEDs are illuminated.


LIE DETECTOR-4
his circuit detects the resistance between your fingers to show the 3LEDs. As you press harder, a lot of LEDs are illuminated. Thecircuit is less complicated than Lie Detector-3. 


Read More

Bed Room Noise Detector Circuit Schematic

This circuit is intended to signal, through a flashing LED, the exceeding of a fixed threshold in room noise, chosen from three fixed levels, namely 50, 70 & 85 dB. Two Op-amps provide the necessary circuit gain for sounds picked-up by a miniature electret microphone to drive a LED. With SW1 in the first position the circuit is off. Second, third and fourth positions power the circuit and set the input sensitivity threshold to 85, 70 & 50 dB respectively. Current drawing is 1mA with LED off and 12-15mA when the LED is steady on.

Circuit diagram:
 Room Noise Detector Schematic Circuit Diagram
Room Noise Detector Circuit Diagram


Parts:

R1 = 10K
R2 = 22K
R3 = 22K
R4 = 100K
R5 = 56K
R6 = 5.6K
R7 = 560R
R8 = 2.2K
R9 = 56K
R10 = 56K
R11 = 1K
R12 = 33K
R13 = 330R

C1 = 100nF-63V
C2 = 10µF-25V
C3 = 470µF-25V
C4 = 47µF-25V
D1 = 5mm. Red LED
Q1 = BC327
B1 = 9V PP3 Battery

SW1 = 2 poles 4 ways rotary switch
IC1 = LM358 Low Power Dual Op-amp
MIC1 = Miniature electret microphone

Use:
  • Place the small box containing the circuit in the room where you intend to measure ambient noise.
  • The 50 dB setting is provided to monitor the noise in the bedroom at night. If the LED is steady on, or flashes bright often, then your bedroom is inadequate and too noisy for sleep.
  • The 70 dB setting is for living-rooms. If this level is often exceeded during the day, your apartment is rather uncomfortable.
  • If noise level is constantly over 85 dB, 8 hours a day, then you are living in a dangerous environment.
Read More

AC Line Current Detector Circuit Diagram

This circuit diagram will detect AC line currents of about 250 mA or more without making any electrical connections to the line. Current is detected by passing one of the AC lines through an inductive pickup (L1) made with a 1 inch diameter U-bolt wound with 800 turns of #30 - #35 magnet wire. The pickup could be made from other iron type rings or transformer cores that allows enough space to pass one of the AC lines through the center.

Only one of the current carrying lines, either the line or the neutral should be put through the center of the pickup to avoid the fields cancelling. I tested the circuit using a 2 wire extension cord which I had separated the twin wires a small distance with an exacto knife to allow the U-bolt to encircle only one wire.

AC Line Current Detector Circuit Diagram

Detector Circuit Diagram

The magnetic pickup (U-bolt) produces about 4 millivolts peak for a AC line current of 250 mA, or AC load of around 30 watts. The signal from the pickup is raised about 200 times at the output of the op-amp pin 1 which is then peak detected by the capacitor and diode connected to pin 1. The second op-amp is used as a comparator which detects a voltage rise greater than the diode drop. The minimum signal needed to cause the comparator stage output to switch positive is around 800 mV peak which corresponds to about a 30 watt load on the AC line.

The output 1458 op-amp will only swing within a couple volts of ground so a voltage divider (1K/470) is used to reduce the no-signal voltage to about 0.7 volts. An additional diode is added in series with the transistor base to ensure it turns off when the op-amp voltage is 2 volts. You may get a little bit of relay chatter if the AC load is close to the switching point so a larger load of 50 watts or more is recommended. The sensitivity could be increased by adding more turns to the pickup.
Read More

Photo Detector with TTL Output Circuit Diagram

This is a photo detector, a detector with TTL output light that can be used in projects for Arduino. This circuit offers low output level when there is enough light, or a light that triggers the system. He can give a command, for example, turn on the lights when it gets dark and off when clear. The output is compatible with TTL level and gives low (LO) when Q1 phototransistor detects light. RV1 with a trimpot, we can adjust the sensitivity.

 Photo Detector with TTL Output Circuit Diagram

Photo Detector with TTL Output Circuit Diagram


Parts List
R1 = 270 Ohm
R2-5 = 1K ohm
R3 = 10K ohm
R4 = 100 ohm
RV1 = 10K ohm
Q1 = BP103 Siemens Phototransistor
IC1 CA3130
C1-2 = 100V 100nF ceramic
IC2 = 74HCT13
D1 = 1N4148-2
Read More

Belgian Earth Fault Detector Circuit Diagram

Having been affected by earth fault accidents,  the author put together this little circuit. It  consist of just three elements: the neon with its  original resistor for example, salvaged from  the switch on an AC power bar and a small  capacitor (class Y) salvaged from the electronics of a low-consumption lamp.


Belgian Earth Fault Detector Image

A larger capacitance makes the neon glow brighter. All this  for no money at all. The neon lights only when there is an efficient Earth present. This works  well at the author’s home, with Live or Neutral either way round. In the Elektor laboratory based in The Netherlands, some concerns  were expressed as described in the June 2011  issue [1], as the circuit was sensitive to the relative positions of the Live and Neutral. So the  Earth fault detector can also be used as a Phase  detector, but probably in Belgium only.
Belgian Earth Fault Detector-Circuit Diagram
.
The whole thing can easily be incorporated into a power socket; the author used a small transparent cover to protect the neon.

Note. As opposed to the UK and the US, some AC  power outlets in Belgium  and all in The  Netherlands are not polarized, i.e. AC power plugs (both earthed  and non-earthed) can be inserted either way around.

Author : Marc Mertz – Copyright : Elektor
Read More

Project of Water level Sensor and Controller Circuit Diagram

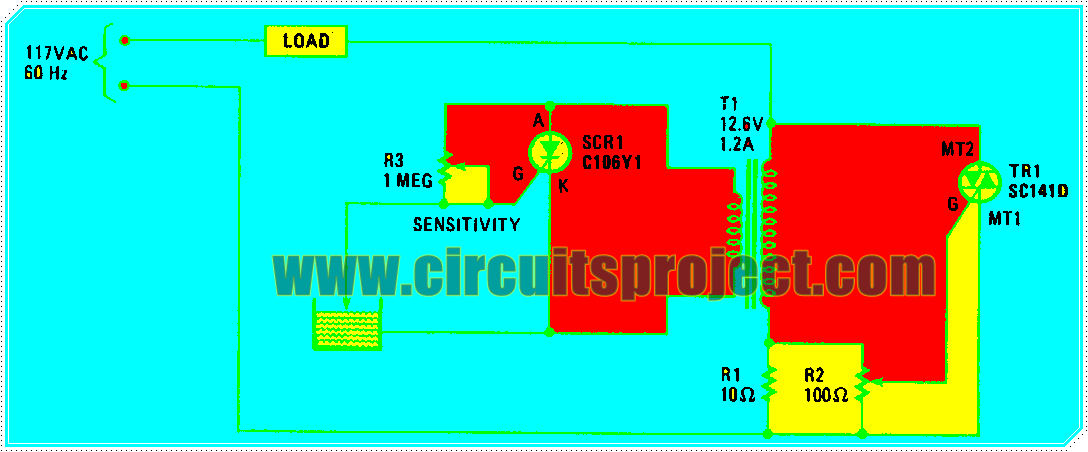
This is a simple Project of Water level Sensor and Controller Circuit Diagram. When the water level is low, the probe is out of the water and SCRl is triggered on. It conducts and imposes a heavy load on transformer Tl`s secondary winding. 


 Water level Sensor and Controller Circuit Diagram


 Water level Sensor and Controller Circuit Diagram


That load is reflected back into the primary, gating triac TRl on, which energizes the load. If the load is an electric valve in the water-supply line, it will open and remain open until the water rises and touches the probe; this shorts SCRl`s gate and cathode, thereby turning off the SCRl, which effectively open-circuits the secondary. That open-circuit condition, when reflected back to the primary winding, removes the triac`s trigger signal, thereby turning the water off.
Read More

Build a Latching Continuity Checker Circuit Diagram

Latching is a fastening, as for a door or gate, typically consisting of a bar that fits into a notch or slot and is lifted from either side by a lever or string. A continuity tester is an item of electrical test equipment used to determine. This circuit detects brief shorts or opens. When S2 is in the up position, the circuit indicates if there is or was continuity by lighting LED1. U1A and U1B are connected as an R-S flip-flop. SI resets the tester. When S2 is in the down position, a momentary interruption in continuity will light LED1. This tester is good for detecting intermittent shorts or opens. 

Latching Continuity Checker Circuit Diagram

Latching Continuity Checker Circuit Diagram

Read More

Liquid Level Monitor Circuit Diagram

Build a simple liquid level monitor circuit diagram. The Liquid-level monitoring plays an important role in today's automotive, oil, water, pressure, pumping oil into a storage tank requires liquid-level monitoring to. This monitor uses a common 7 41 amp configured as a comparator and a low cost non transistor as an output driver. Read: Signal Tracer Injector Circuit

 Liquid Level Monitor Circuit Diagram

Liquid Level Monitor Circuit Diagram


With no liquid detected, a voltage of about 2. 92 V is present in the op amp`s inverting input at pin 2. The 100-KO resistors establish a reference voltage of +2. 5 V at the non inverting input at pin 3 of the op amp. Under those conditions, the op amp`s output is -3.56 V, which keeps the 2N2222 transistor turned off and the voltage across its 1-KO output load resistor at 0 V. 


When liquid reaches the probes, the 3.3-MO and 22-KO resistor circuit conductivity connects to ground. When enough current, about 1.4 p.A, flows through the liquid, the small 30 m V drop developed across the 22-KO resistor drives the op amp to deliver an output voltage of about 4.42 V. This voltage then drives a 2N2222 transistor into saturation, which generates a voltage drop of about 3.86 V across its 1-KO output load resistor.
Read More

Simple Signal Tracer Injector Circuit Diagram

This is a simple signal tracer signal circuit diagram.This signal tracer injector has been designed to inject or detect a specific signal into an audio circuit, tracer may also be used as a simple monitor or amplifier. The injector is a CMOS oscillator with period approximately equal to 1 x Cl x R2 seconds. The values are given for 1 kHz operation. Read : G Purpose Preamplifier Circuit Diagram

 Simple Signal Tracer Signal Circuit Diagram


Simple Signal Tracer Signal Circuit Diagram


Resistors R3 and R4 divide the output to 1 V; Whereas the oscillator employs the gates in their digital mode, the tracer used them in a linear fashion by applying negative feedback from output to input. They are used in much the same way as op amps. 


The circuit uses positive ground. It offers an advantage at the earphone output because one side of the earphone must be connected to ground via the case. Use of a positive ground allows the phone to be driven by the two N-channel transistors inside the CD4001 which are arranged in parallel and are thus able to handle more current for better volume.
Read More

Digital Electronic Thermometer Circuit Diagram

Build a Electronic Thermometer Circuit Diagram. A thermometer thermos, meaning "hot" and  metron, "measure") is a device that measures temperature or temperature gradient using a variety of different principles. A thermometer has two important elements: the temperature sensor in which some physical change occurs with temperature, plus some means of converting this physical change into a numerical value. 

An inexpensive electronic thermometer is capable of measuring temperatures over a range of from -30°F to +120°F. A diode-connected 2N3904 transistor used as the temperature sensor forms a voltage divider with Rl. As temperature increases, the voltage drop across the transistor changes by approximately -1.166 millivolts-per°F. As a result, the current at pin 3 of IC1, a 741 op amp with a gain of 5, decreases as the temperature measured by the sensor increases. A second 741 op amp, IC2 is configured as an inverting amplifier.

 Electronic Thermometer Circuit Diagram


Electronic Thermometer Circuit Diagram

 Resistors R5 and R6 calibrate the circuit. Calibration is also straightforward. When properly done, a temperature of - 30°F will result in a meter reading of 0 milliamps, while a temperature of 120°F will result in a meter reading of 1 milliamp. Divide the scale between those points into equal segments and mark the divisions with the appropriate corresponding temperatures. The calibration is completed by placing the sensor in an environment with a known temperature, such as an ice-point bath. Place the sensor in the bath and adjust R6 until you get the correct meter reading.
Read More

Build a Hi-low Temperature Sensor Circuit Diagram

This is a Hi-low Temperature Sensor Circuit Diagram. Temperature sensors are devices used to measure the temperature of a medium.There are 2 kinds on temperature Hi and low. Resistors Rl, R2, and the two 2.2 k resistors form a bridge circuit. R2 is a thermistor, and Rl sets the temperature at which L2 lights. Lower or higher temperatures light LI or L3 to indicate an over- or under-temperature condition.

Hi-low Temperature Sensor Circuit Diagram


Hi-low Temperature Sensor Circuit Diagram

Read More

Digital Short Finder Circuit Diagram

This is a simple digital short finder circuit diagram is a specially designed tool for tracking and tracing short and open circuits, broken wires and current leaks on any electrical circuit. In this circuit Transistors Ql and Q2, together with resistors Rl through R7, make up the input balancing stage, which senses the resistance between points X and Y. The input stage is essentially a bridge, consisting of Rl, R2, R6, R7, and the resistance between points X and Y.

 Digital Short Finder Circuit Diagram


 Digital Short Finder Circuit Diagram


Transistors Q3 and Q4 and their associated passive components form a buzzer, which sounds when the tester detects a short. The buzzer is controlled by the output from Q2. When the input resistance is high (more than about 10 ), Q2 turns on, so its collector potential is close to ground, and the buzzer remains off. When the input resistance is sufficiently low, Q2 turns off, and the buzzer sounds. The frequency of the sound, which is about 1000 Hz, can be adjusted by varying the value of capacitor (C).
Read More

Simple Line Current Detector Circuit Diagram

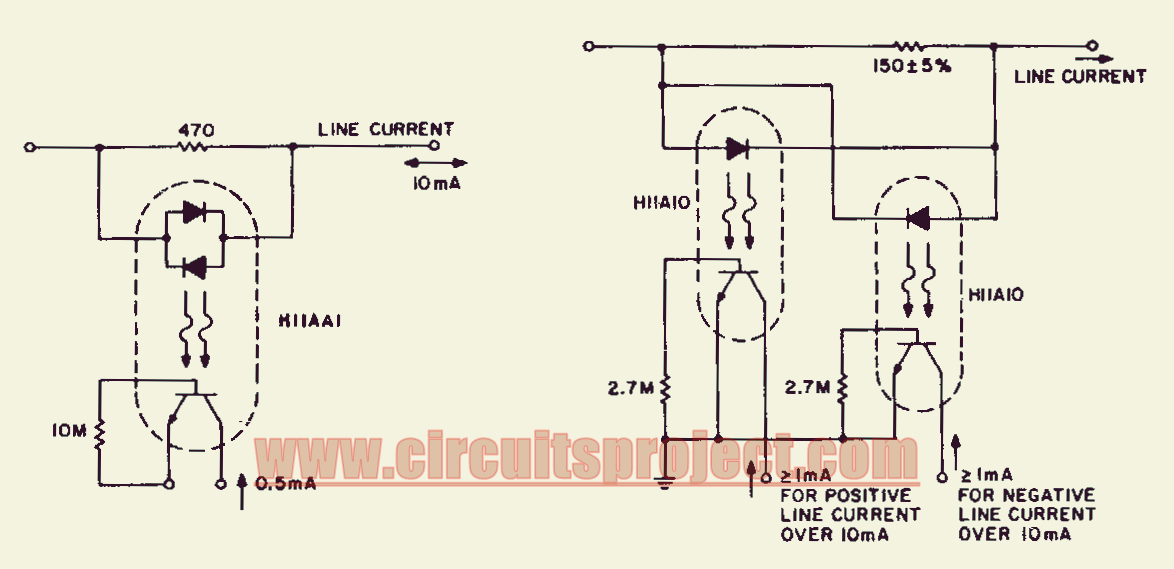
This is a simple Line Current Detector Circuit Diagram. This circuit will detect line currents of about 250 mA or more without making any electrical connections to the line.Detection of line-current flow and indicating the flow to an electrically remote point is required in line status monitoring at a variety of points in the Telephone system and auxiliary systems. The line should be minimally unbalanced or loaded by the monitor circuit, and relatively high levels of 60-Hz induced voltages must be ignored. 

 Simple Line Current Detector Circuit Diagram


Simple Line Current Detector Circuit Diagram

The H ll A Al allows line currents of either polarity to be sensed without discrimination and will ignore noise up to approximately 2.5 mA. In applications where greater noise immunity or polarity- sensitive line-current detection is required, the HllAlO threshold coupler can be used. This phototransistor coupler is specified to provide a minimum 10% current transfer ratio at a defined input current, while leaking less than 50 p.A at half that input current over the full -55°C to + 100°C temperature range. The input current range, at which the coupler is on, is programmable by a single resistor from 5 to 10 mA.
Read More